
The following is an article I published in Free Inquiry this summer, reposted here with permission.
The TL;dr: a paper was published earlier this year, announcing the complete sequencing and analysis of the genomes of all (living) ape species, including all repetitive regions. These are very difficult-to analyze sections of our genomes that, while being almost purely repetitive junk, nevertheless help us understand how genomes evolve over deep time.
Then, suddenly, creationists suddenly declared that this paper found that human and chimpanzee genomes are only 85% similar, instead of the 98-99% similarity that is usually reported.
To be sure, the paper found no such thing. The claim comes from a supplemental figure, very badly misinterpreted by the creationists, that discusses alignment percentages, not sequence similarity, and nothing in this paper is at odds with what we have understood about human and chimpanzee genomes for decades. It just added further precision and detail onto that understanding.
But genome comparisons are complicated and interesting, and so this is an opportunity to shed a little light on how our genomes evolve while debunking the latest pseudoscience nonsense from the Intelligent Design community.
So here is my article, reprinted in full, courtesy of Free Inquiry magazine. I hope you enjoy!
The Trump administration seems determined to gut the scientific research establishment in the United States. Consider:
- Despite the fact that vaccines have likely saved over 100 million human lives (more than any other technology except water sanitation), our country’s vaccine policy is now led by a vaccine skeptic.
- Despite the fact that over 97 percent of published climatologists agree that human industry is leading to potentially disastrous disturbances of the global climate, both the Environmental Protection Agency and the Department of the Interior are led by climate skeptics.
- Despite the National Institutes of Health and the National Science Foundation establishing the United States as the far-and-away global leader in science, budgets are being slashed and programs cancelled at both institutions.
A scientific brain drain has already begun, and the era of American dominance in science may well be drawing to a close, murdered by self-inflicted wounds.
Emboldened by the success of their fellow pseudoscientists, creationists are asserting themselves more boldly as well. After a half-century of judicial defeats, intelligent design (ID) proponents are again pushing into American science classrooms, with a new law in West Virginia allowing teachers to introduce alternative theories for “how the universe and/or life came to exist,” and similar bills have been introduced in Oklahoma and South Carolina. Proposed legislation in North Dakota goes even further and would require the inclusion of ID in K–12 science standards. A century of expensive and hard-fought victories in maintaining integrity in public school science teaching is at risk.
Most recently, a creationist named Casey Luskin sent a letter to The Smithsonian Institution’s National Museum of Natural History demanding that their display on genetic similarity be revised in response to a more complete analysis of ape genomes recently published in Nature. According to Luskin, the new data reveal that humans and chimpanzees have only around 85 percent genetic similarity, while the consensus view displayed by the Smithsonian is ~98.8 percent. Luskin is correct that a more complete analysis of ape genomes was recently completed. But that is just about the only thing he got right.
We ought not fault Luskin for getting his genetics wrong. He is not a genome scientist or a molecular biologist. He’s an attorney and a very minimally credentialed geologist who briefly studied rock formations. By my count, he has published just three research articles and a couple of conference presentations. This is not the record of a scientific expert of any kind, and he has literally no training in genetics, but this is par for the course for ID creationists, who routinely challenge entire disciplines despite having no credentials or experience in that discipline.
Simply put, Luskin has no idea what he is talking about, but it’s worth shedding some ink to debunk this particular challenge, because he claims to be quoting directly from an article published in a top research journal. Let’s look at what the data actually say.
How Is Genetic Similarity Measured?
Determining the “genetic similarity” of two organisms would be easy if our DNA was a simple string of nucleotides — the four letters of our genetic alphabet — of equal length. But genomes are more complicated than that. And worse, over time, DNA mutates in a variety of ways, some subtle, some drastic. Sequences can change, stutter, or be deleted. Small chunks of DNA can copy themselves, and the superfluous clones can insert themselves elsewhere at random. And those are just the micro-scale changes. Entire chromosomes can break, duplicate, fuse, invert, and even be lost altogether.
In short, genomes are messy and comparing them requires tremendous computing power that has only recently become available, hence the new publication on ape genomes.
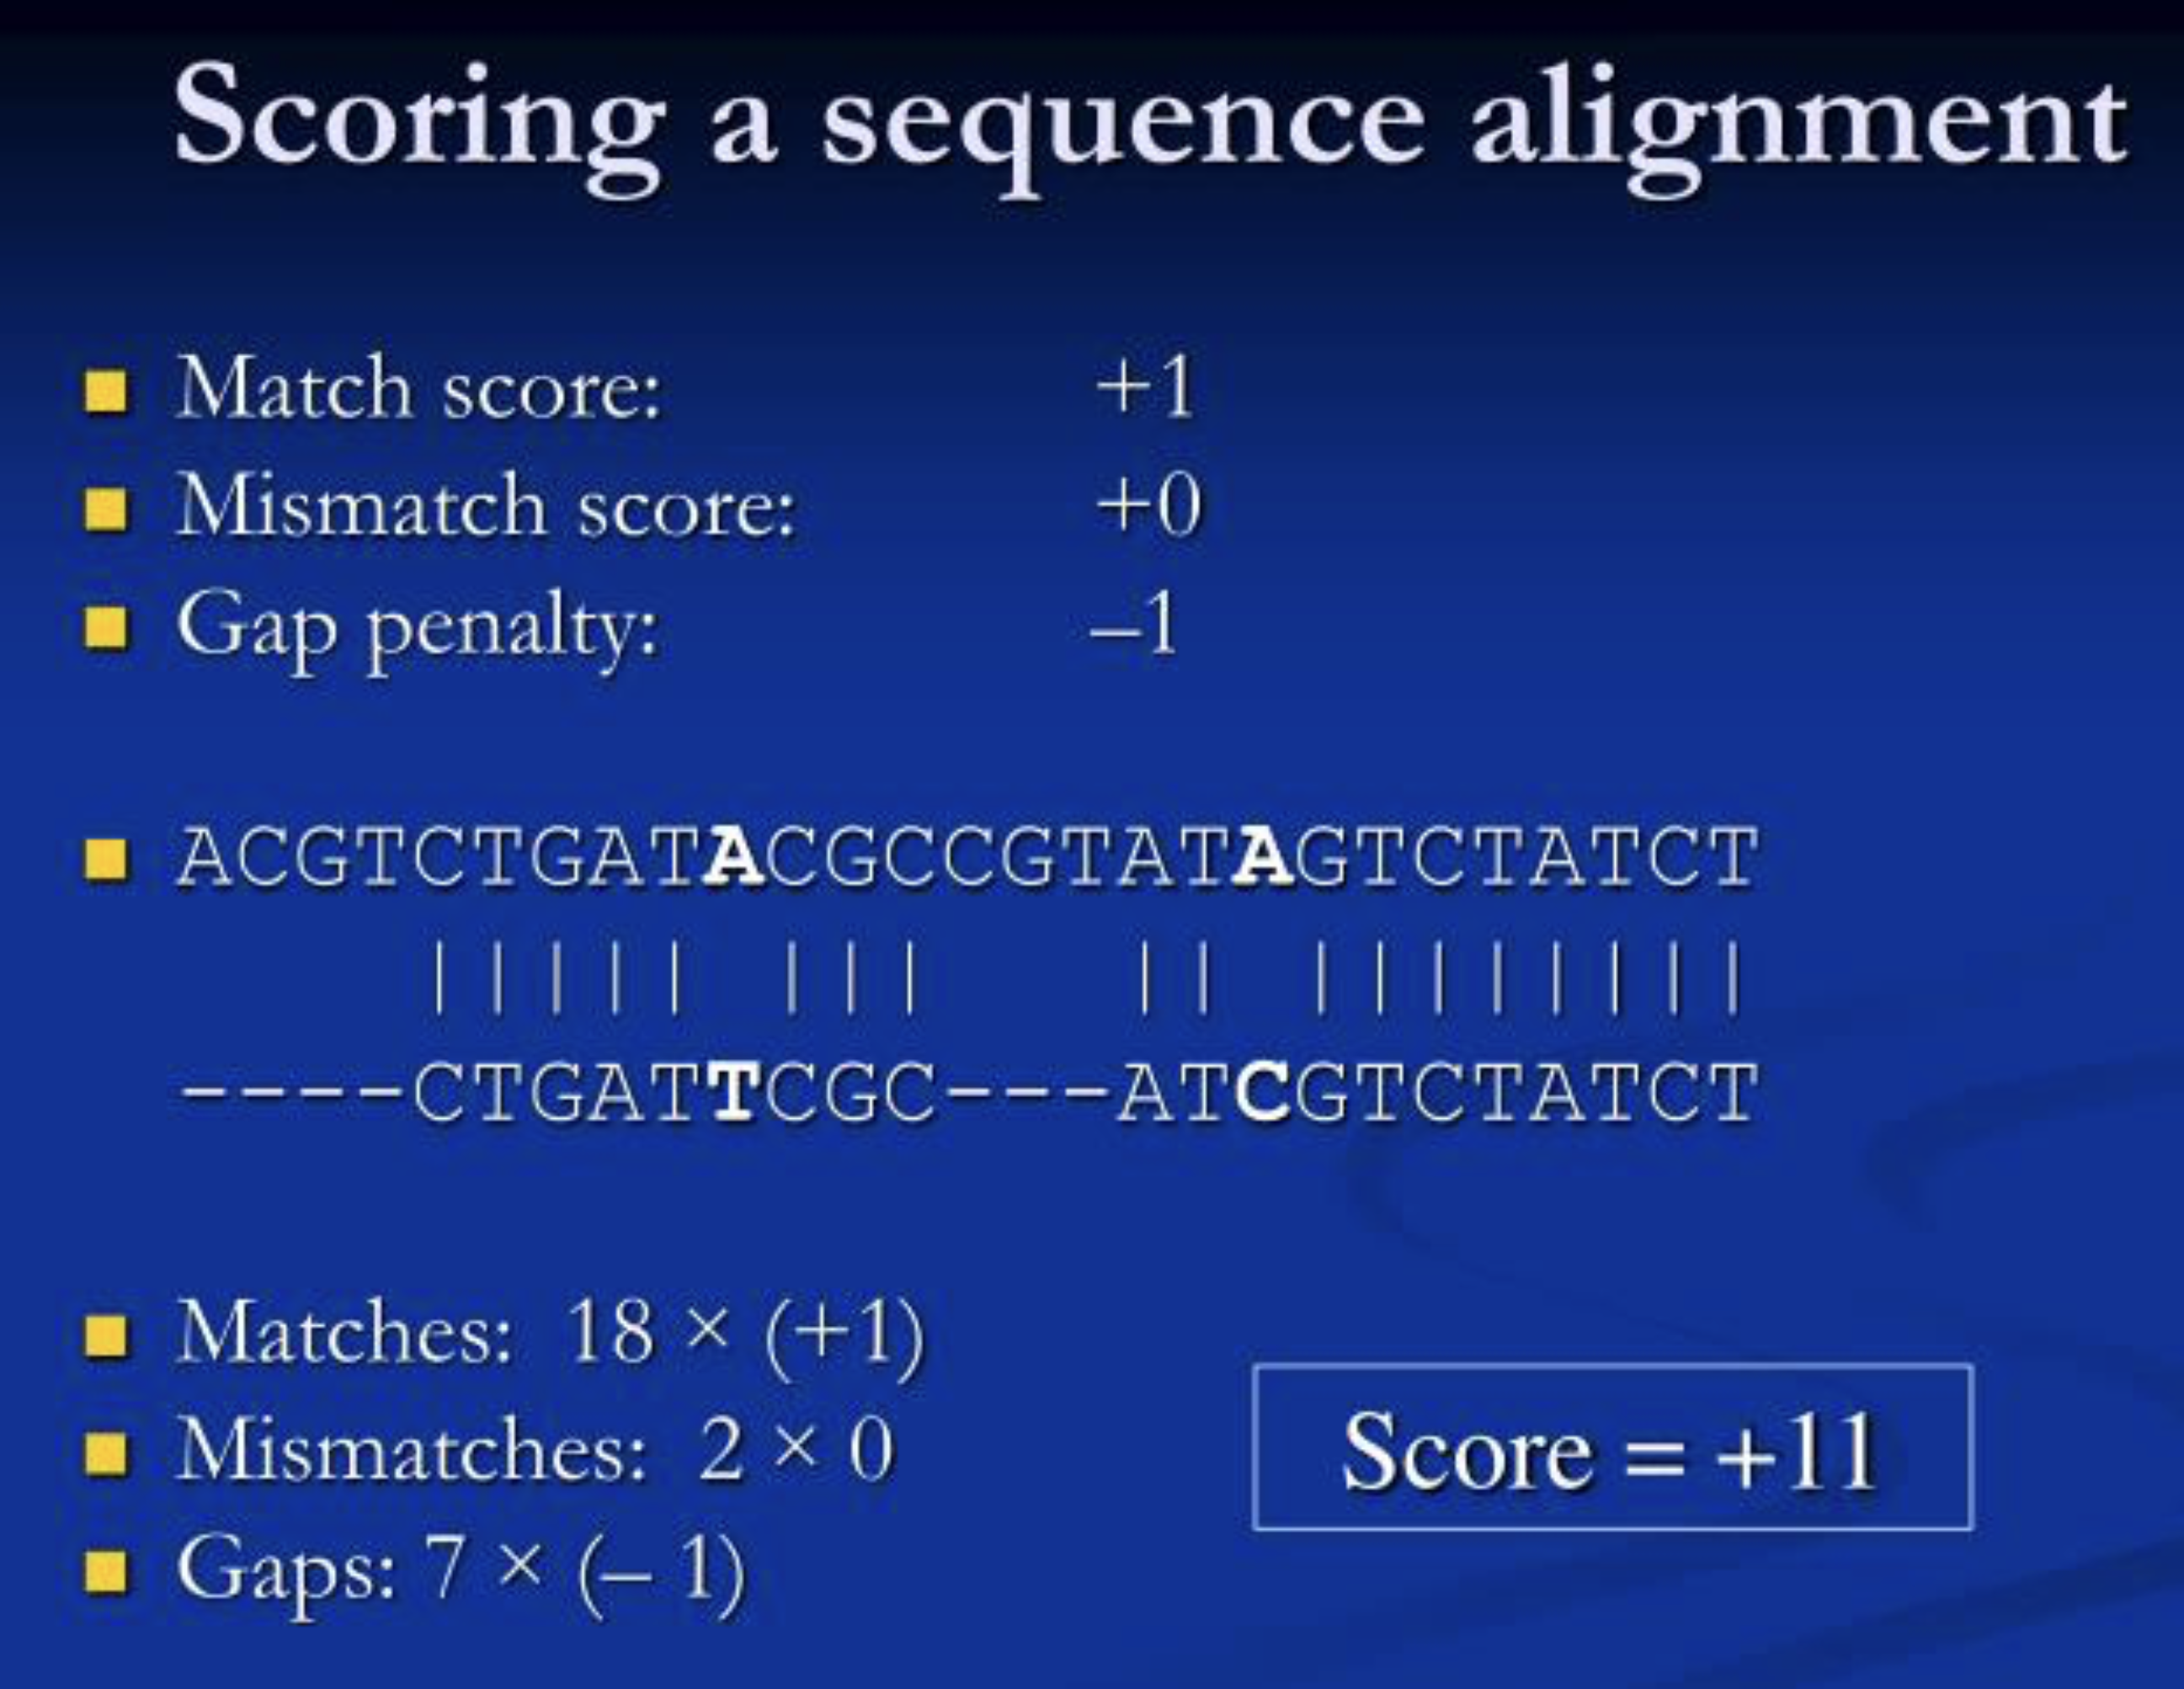
Let’s consider a simple example. Imagine a DNA sequence that is 100 nucleotides long, something like: GCTATTCGAGAC … . If one of those nucleotide letters mutates into a different one, becoming GCCATTCGAGAC …, we can say that the new sequence is 99 percent similar to the ancestral one, because the only difference between them is one letter out of a hundred. Nice and easy.
Now imagine that, instead of a nucleotide substitution, a given DNA sequence experiences a repeat expansion. Consider this sequence: CAGCAGCAGCAGCAGCAG. Here we see that CAG is repeated several times. Repeats like that tend to expand and contract over evolutionary time. An ancestral species may have had twenty CAG repeats in a row, forming a sixty nucleotides-long string. But a descendent species may have twenty-five CAG repeats in that same place. This sequence is seventy-five nucleotides long. It’s the exact same sequence—CAG—repeated a different number of times. How similar are these sequences?
Because 60 divided by 75 equals 0.8, it may be tempting to call this 80% similar, but that would be grossly misleading because a 20% difference could signify tens of millions of years of evolutionary divergence. But with repetitive DNA, that kind of difference can appear literally overnight. Clearly, different kinds of DNA changes must be handled differently and cannot be directly compared. Scientists might say these sequences are 100 percent identical and 80 percent aligned.
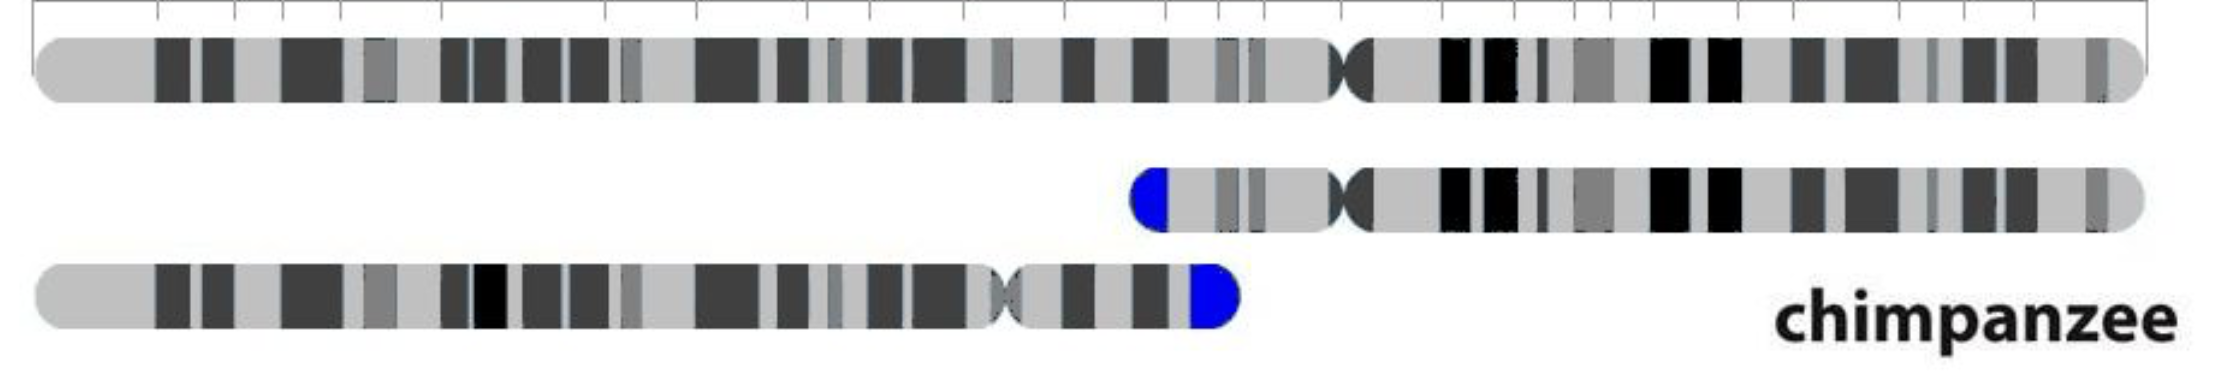
There’s more. In some instances, two organisms may harbor almost all the same DNA sequences but arranged differently. Such is the case with human chromosome #2. Around a million years ago, in one of our ancestors’ egg or sperm cells, two small chromosomes fused to form a larger one. But almost all the DNA remained intact (although it has accumulated subsequent mutations, which is what allows us to approximate when this fusion occurred). This is an alignment gap of around 45 or 55 percent, when viewed from the perspective of the chimpanzee chromosomes, but from the human genome perspective, there is hardly a gap at all. There is no simple answer to the question of how similar our chromosome #2 is to its ape counterparts because they don’t really have our chromosome #2, even though they do have nearly all its DNA.
Because of all this chromosomal chaos, genome scientists often focus on what is called “coding DNA”—the digital information for building proteins. This is what is usually presented to the public, partly because it is the simplest way, but also for two good scientific reasons.
First, coding sequences are much more stable than other areas of the genome and tend to mutate in slow and predictable rates over time. This allows direct comparisons, especially among close relatives. Coding DNA sequences between humans and chimps are ~99.5% similar, while coding sequences between humans and mice are about 85% similar, and this is mathematically consistent with how related we are to each. The same logic applies to ribosomal RNA genes, mitochondrial DNA, and some regulatory and structural DNA sequences. These can be used like a “molecular clock,” with each type of DNA “ticking” at a different rate. For example, protein-coding regions tend to mutate very slowly: each nucleotide has about a 1 in 100,000,000 chance of mutating in each generation. At the other extreme are microsattelite repeats, the regions used in forensic DNA identification. These tend to expand and contract much more commonly, with each having about a 1 in 1,000 chance of being altered in each generation. By analyzing a variety of genomic regions, our estimates of divergence times and genetic similarity are continually refined.
Second, changes in coding regions are also, arguably, the most important functional differences between species, so this is where we often focus our attention when considering how similar two genomes are. (This view may change somewhat as we gain a fuller appreciation for the importance of regulatory regions, RNA genes, and other so-called noncoding DNA sequences.) When museums such as the Smithsonian say that humans and chimpanzees are 98.8% similar, they are talking specifically about well-aligned sequences, which includes all of the functional regions of the genome, which encode the observable differences in our two species.
The Problem with Sequence Repeats
Repetitive DNA poses a particular problem for genomics, even just for assembling a genome in the first place. In the laboratory, DNA is sequenced in short chunks, usually a few hundred nucleotides long. In coding regions and other functional areas of the genome, the chunks are unique and overlap with each other considerably, allowing scientists to “tile” the chunks together. But some repetitive regions are so long that many of the sequence chunks are identical and will overlap in almost infinite possible ways. When many tiles are all identical, it’s not obvious how to string them together or even how many tiles there are in total.
Consider telomeres, the extreme ends of chromosomes, which consist of TTAGGG repeated many hundreds of times. Imagine cutting these into small chunks and then attempting to piece them together again. It becomes nearly impossible to know for sure exactly how long these regions are by sequencing alone. Scientists must use sophisticated computation to find and exploit tiny differences, aided by size estimates generated through other techniques, to painstakingly assemble the full genomic sequence. While the first draft of the human genome was released to great fanfare in 2001, the first complete telomere-to-telomere (T2T) sequence was not completed until twenty-one years later.
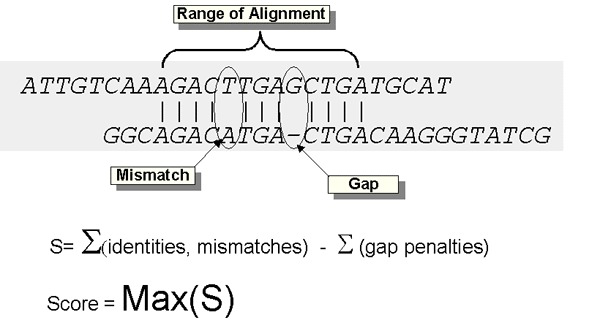
These same computational techniques can also be used to compare genomes, a process that is ongoing as methods are refined. Even so, addressing the question of genetic similarity between two organisms depends a great deal on the criteria used to decide what is a match. The images below illustrate this point. These are alignments of human chromosome #21 with its chimpanzee counterpart, generated in my research lab. Purple represents spans of DNA sequence with very high similarity between the two species, while blue also represents similar sequences but that are inverted relative to one another.
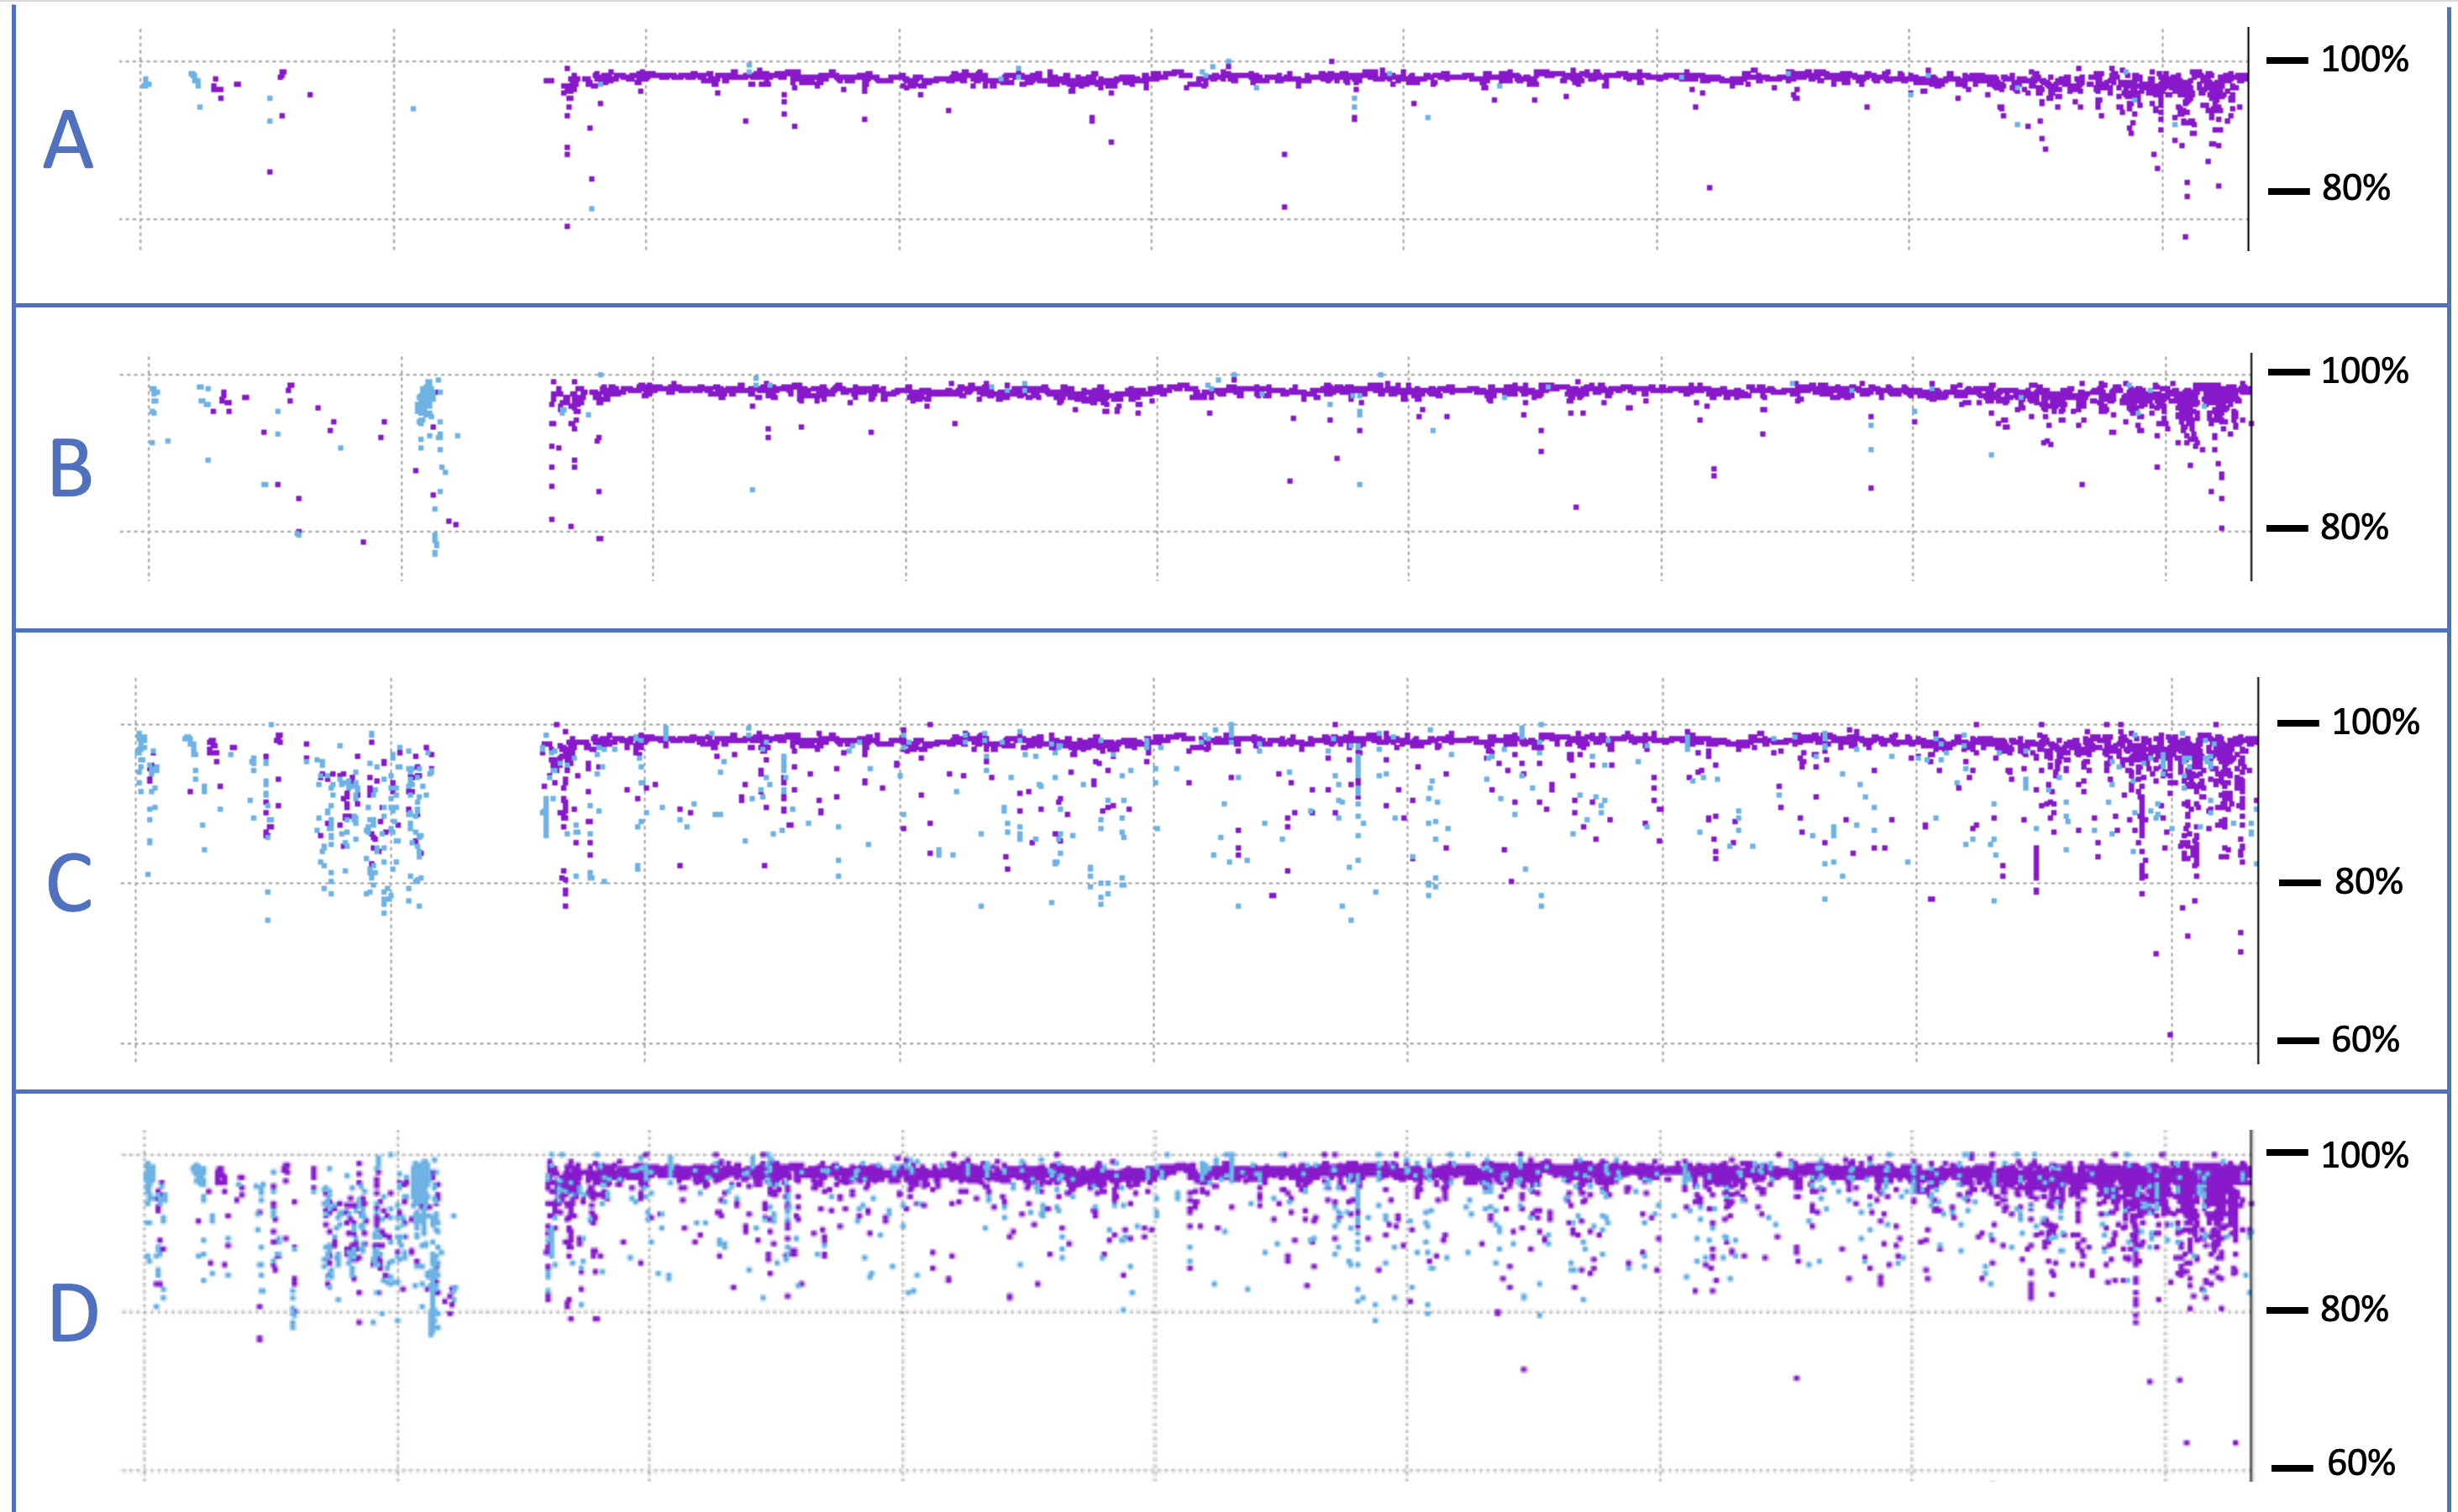
The uppermost image – A – was generated using strict matching criteria, which were then relaxed for image B. Relaxed criteria leads to more sequence matches, especially for inverted (blue) sequences. However, in panels C and D, we allow for alignments with sequences from anywhere in the chimp genome, rather than limiting the search to chromosome #21, as in A and B. What these bottom two panels reveal is that DNA sequences don’t just mutate over evolutionary time, they also move. Most of these small pieces of DNA are called “transposable elements,” which are notorious for copying themselves pointlessly and aggressively. When the copies insert themselves back into the genome at some random location, they do so in either orientation, forward or backward. The result is that our chromosomes are littered with this parasitic DNA junk. (Intelligent design, you say?!)
Parasitic DNA jumping from chromosome to chromosome complicates any effort to give a simple answer to the question of “how similar” two genomes are. Across the four panels above, the alignment score ranges from 87–98%. None of these values is “correct,” because it depends on how you measure. This is why scientists often consider only the more stable regions of the genome—genes and pseudogenes—to make these kinds of estimates.
There is one additional thing worth noting in these images (which were generated as part of a separate research project that you can read about here). When we really dig into some of the alignment gaps in chromosome #21, we observe extensive segmental duplications and rearrangements. Fascinatingly these have occurred within an array of ribosomal RNA genes, which in turn created new microRNA genes, which may have played crucial roles in our unique evolutionary trajectory. When it comes to unraveling the mysteries of our genome, sequencing the DNA is merely the first step. Fully understanding those sequences will take decades to come.
The New T2T Analysis of Ape Chromosomes
And now we come to the matter at hand, the recently published complete chromosomal sequence of six other apes: chimpanzees, bonobos, Western gorillas, Bornean orangutans, Sumatran orangutans, and one species of gibbon—the siamangs. Like the human T2T genome assembly published three years ago, these revised ape genomes contain the complete chromosomal sequences, from telomere to telomere, with almost no gaps remaining. This is an impressive feat made possible by two recent advances: the development of next-generation DNA sequencing technology that produces longer sequence reads, and new chromosome assembly algorithms. With the exception of some centromere regions—which are tens or hundreds of millions of nucleotides of purely repetitive satellite DNA—we now have approximately 99.8% of the precise, unbroken DNA sequence of all chromosomes in these apes.
The figure below shows two representative chromosomes—#7 and #16—and how they align among humans and the six apes. The high level of direct alignment among these chromosomes, shown in blue, is readily apparent. But so, too, is the degree of inverted alignment, shown in yellow. These inversions represent the nearly exact same sequence, just backward.
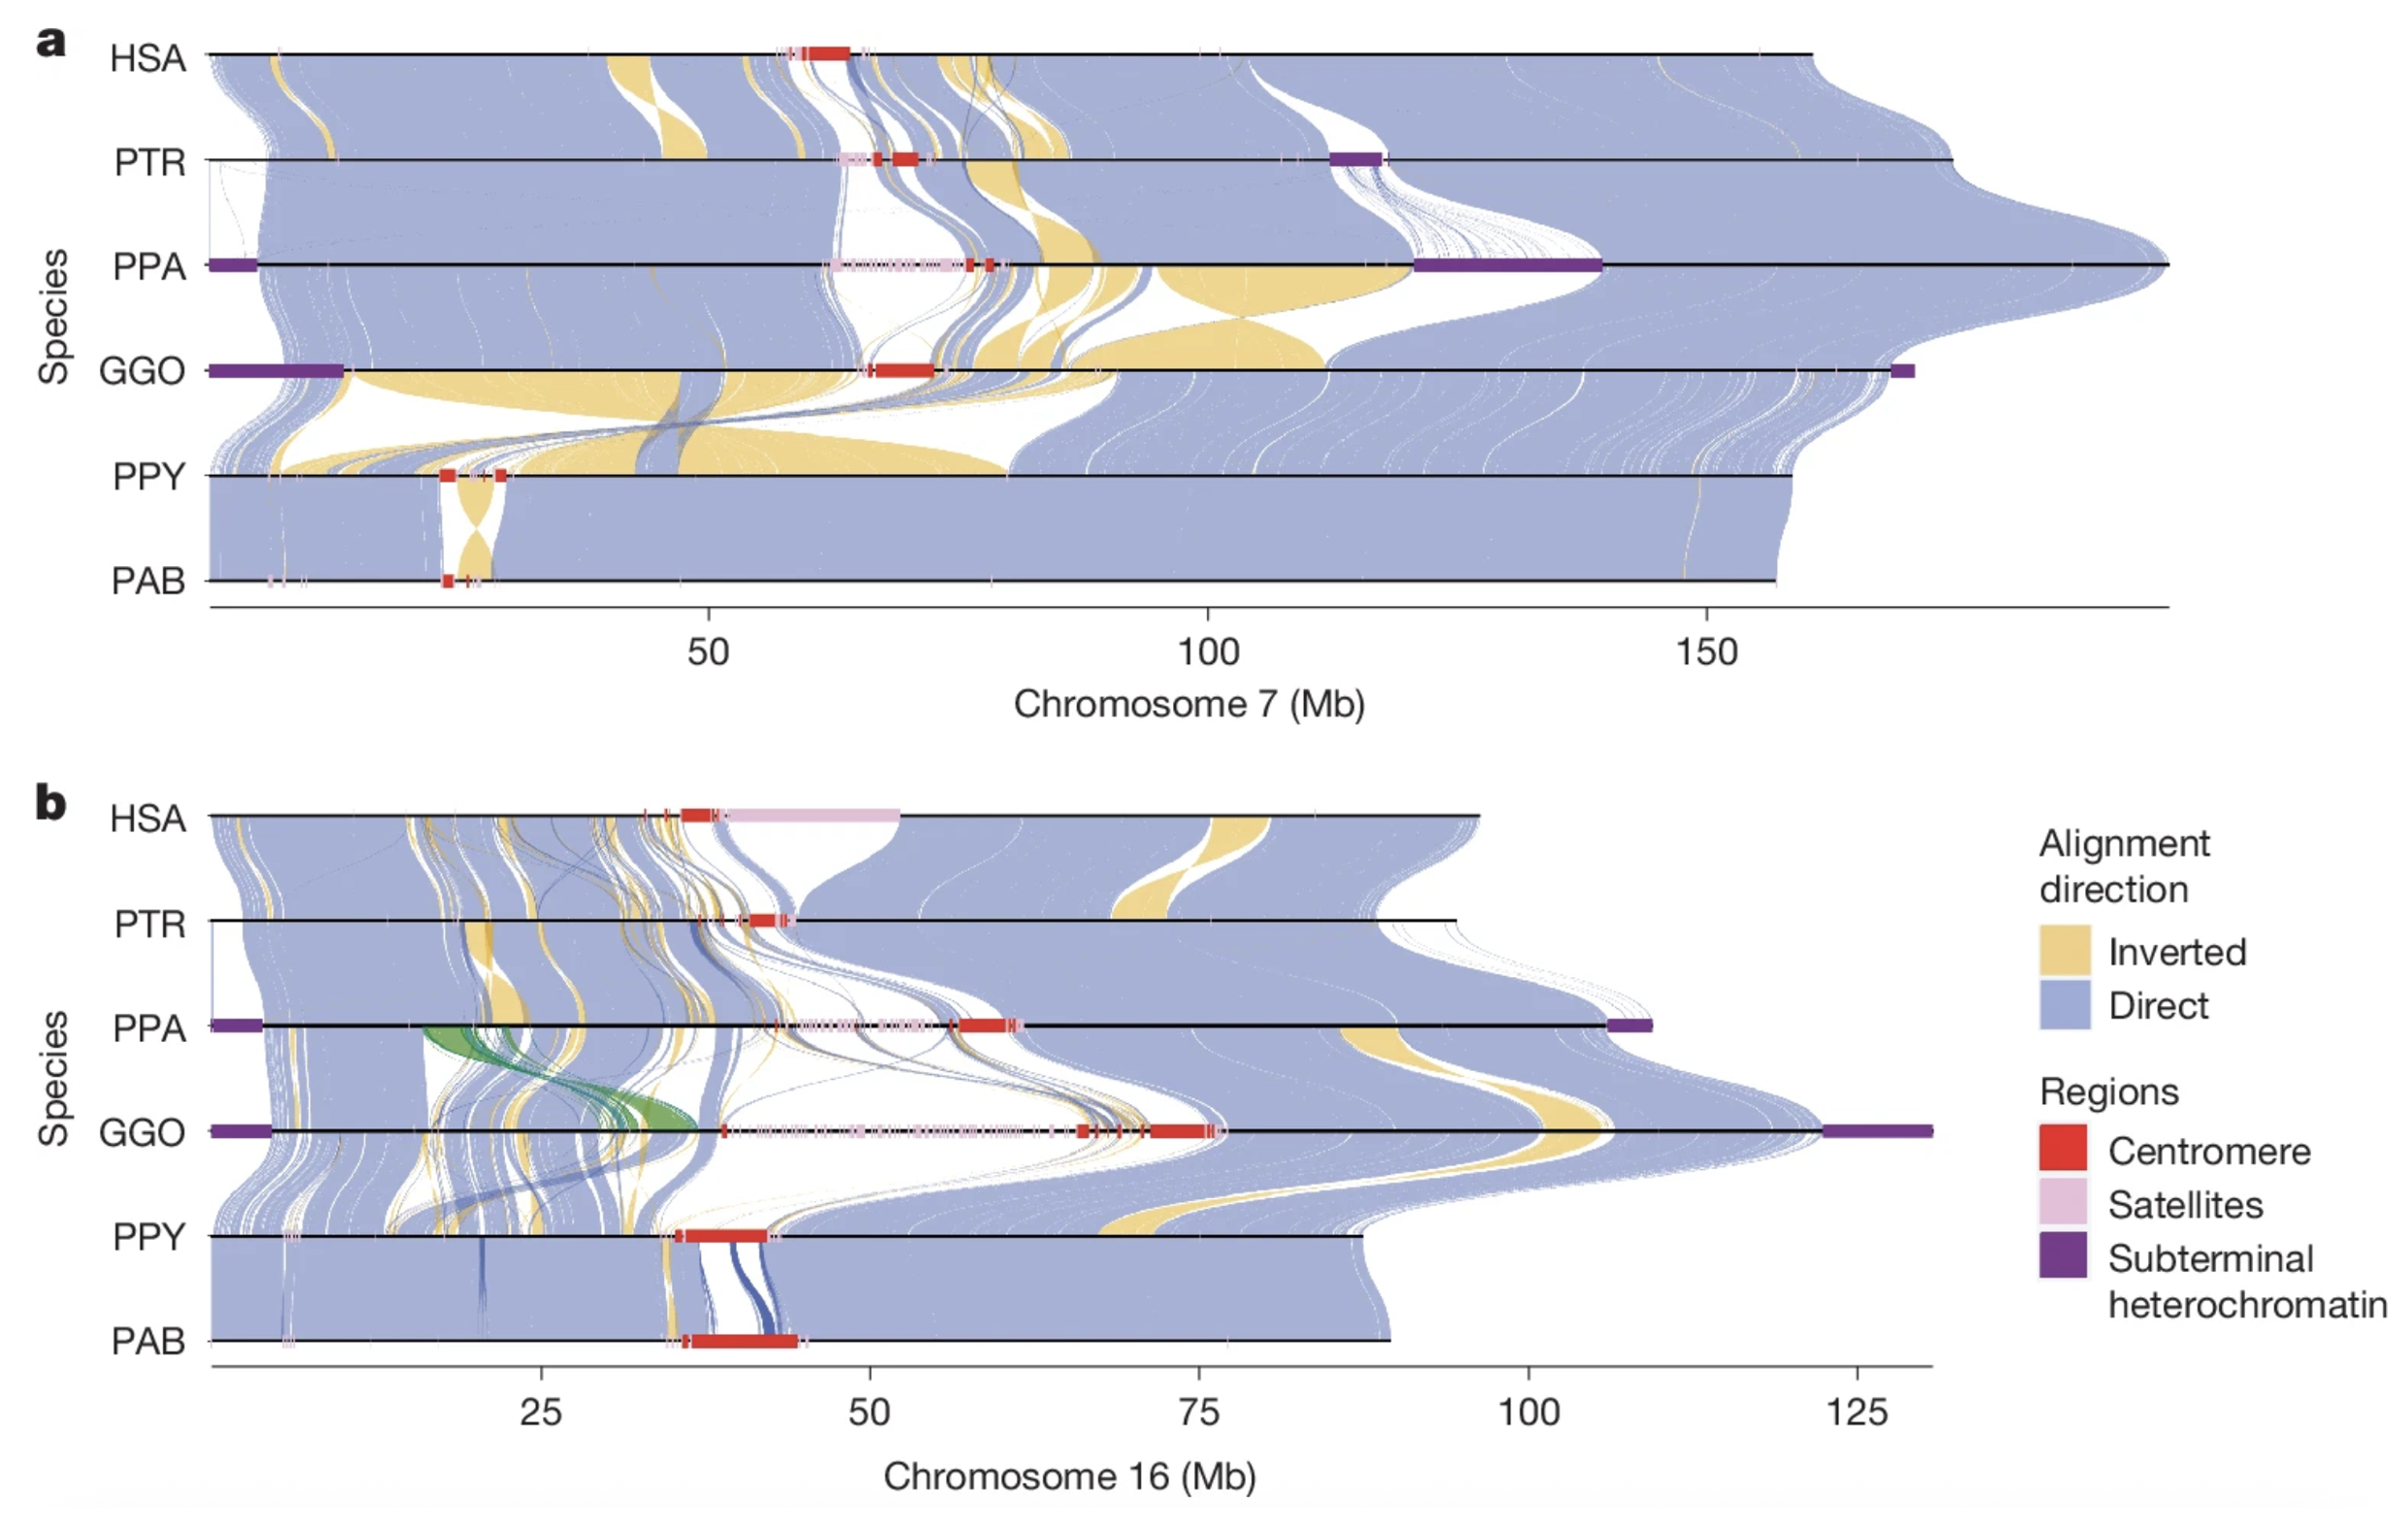
You can see here that these two chromosomes align better among the apes than chromosome #21 does. This is because chromosome #21 is one of five acrocentric chromosomes, which are notoriously messy and contain long stretches of DNA junk called “gene deserts.” These lead to large alignment gaps, which are interesting to genome scientists but basically irrelevant otherwise.
The full analysis of these ape genomes has provided a more complete understanding of some genomic regions that were mostly obscured until now, including the genes for the Major Histocompatibilty Complex (MHC) proteins, T-cell Receptors (TCRs), and the immunoglobulins (antibodies), which are key players in our adaptive immune systems. The analysis also revealed about a thousand genes that are specific to various ape species, while also clarifying which human genes are truly unique to us, including some involved in the development of the frontal cortex. Completing the assembly of highly repetitive regions has clarified significant portions of some chromosomes, which will fuel discoveries for many years to come, and it also provides us with a great deal more data about how genomes evolve, including our own.
Luskin Is Lost
So, what emboldened Luskin to demand that The Smithsonian revise its claim that human and chimp genomes are 98.8% similar? As mentioned above, the different biotypes of DNA—such as protein-coding genes, RNA genes, pseudogenes, regulatory regions, intergenic regions, repetitive regions, transposable elements, and so on—require different approaches for comparative analysis. Also, we use very stringent criteria when we zoom in close and more relaxed criteria when we look at the whole chromosome. Throughout this research article, literally dozens of different analyses were performed that vary in their scope, alignment criteria, DNA regions, and so on.
The two kinds of numbers that are most often reported—sequence similarity (or sequence identity) and alignment percentage—measure very different things and attempt to account for both sequence changes and copy-number variations, respectively. Neither tells the whole story, so in a genomics research article, you will find a lot of comparisons and numbers. The alignment percentage will always be lower than the sequence similarity, but it’s also less relevant to the underlying biology, because this DNA is largely nonfunctional.
Luskin cherry-picked a single piece of data, exaggerated it, striped it of key context, and declared that it supports a claim that is totally at odds with all everything else from the same research study. Luskin quoted numbers from supplementary figure III.12, in which the scientists reported gap divergences between humans and different ape species, computed as an average across one million nucleotide segments, and found either 12.5% or 13.3% gap divergence between humans and chimpanzee non-sex chromosomes, depending on from which genome you compute.
Gap divergence is a specific measure of how much of the chromosomes cannot be neatly aligned due to repeat expansions and contractions, but Luskin somehow claims it overturns everything else that’s ever been done in comparative genomics, declaring that “researchers discovered that human and chimpanzee genomes are only 85% similar.” That is not what gap divergence means, and heaps of data throughout the paper agree that human and chimpanzee genomes are 98–99% similar in their aligned DNA sequences. The data in figure S-III.12 merely quantitates how much chromosomal alignment is hampered by copy-number variation and is not a measure of genome similarity. More importantly, all the gap divergence values found in figure S-III.12 are simply more precise versions of values that we have known for decades, which is why these updated figures were relegated to supplementary figures rather than in the main article itself.
You will no doubt notice that even the reported 13.3% gap divergence is less than Luskin’s claim of 15% difference. This is because, in addition to the 12.5% or 13.3% difference in gap alignment, the authors found a 1.5% difference in the DNA sequences that are well aligned. (This is the 1.5% DNA sequence difference presented by museums such as The Smithsonian.) Bizarrely, Luskin simply added the two values together: 13.3% + 1.5% = 14.8%. These are two different kinds of analyses on two different kinds of DNA, and it makes no sense whatsoever to add them together.
Even more laughable is Luskin’s claim that the researchers buried this supposed smoking gun in a supplementary figure surrounded by “arcane jargon” and clearly implied that their doing so was a deliberate attempt to hide something. Given his lack of training, it’s not surprising that he finds the technical language of genomics confusing and impenetrable, but more to the point, supplementary figures are where researchers provide more transparency than journal space allows. Supplementary data is how we provide access to our raw data and methodology in full detail so that other specialists can repeat our work if they wish. In other words, it’s the opposite of “burying results.” Again, this is something Luskin would know if he were a scientist.
Luskin Is Lying
There is an unfortunate coda to this story. Not content with just being wrong, Luskin took another page from the creationist playbook: he altered a figure to hide conflicting data.
Because his claims were even more ridiculous than usual, debunkers from all corners of the internet ripped him to shreds. Two of my favorites: the ever-brilliant Gutsick Gibbon for a long-form response (or an even longer one), and Creation Myths for a more pithy one.
In response, Luskin made another post in which he showed data from the article—supplementary figure III.12—to support his position. Except, he only showed part of the figure, the part that showed 13.3% gap differences between humans and chimps. Luskin surgically removed graphs of the within-species gap differences for all the apes. This is important context that makes it clear why gap differences don’t say what Luskin wants them to.

The data omitted by Luskin shows that, among any two unrelated orangutans, there is an average gap difference of 6.7%. Among gorillas, there is a whopping 13.8% gap difference. For bonobos and chimps, it’s around 8%, and for human beings, it’s just 3.5%. (This is because we, as a species, are younger and more closely related than the other apes. As I frequently tell my students, if we could identify the two most distantly related humans, they would still be genetically closer to each other than two unrelated chimpanzees in the same troop.) Also worth noting: the preceding graph showed the average sequence divergence, which for chimps and humans was, you guessed it, about 1.5%.
The crucial point here is that the gap difference between humans and chimps is about the same as the average gap difference between any two gorillas. This fact alone shows why gap differences aren’t useful for assessing the relatedness of two genomes and says little or nothing about ancestry, unless Luskin also believes that every gorilla is its own species.
Although Luskin couldn’t even cherry pick the right kind of data to make his point, he did somehow know enough to leave out the data that shows why that is. Astute readers may recall that, back in 2019, I caught Michael Behe, another intelligent design creationist, blatantly omitting data that undercut his claims. When it comes to creationists misrepresenting other people’s data, it’s déjà vu all over again.
In summary, the complete sequencing of ape genomes is an incredible triumph of technology and fills some important gaps, if you’ll pardon the pun, in our understanding of how some of the most difficult-to-study parts of our genomes have evolved over the past twenty million years.
This work did not, however, change our understanding of how apes are related to one another, how long they have been evolving separately, or even how genetically similar we are. It merely refined our understanding, providing greater detail and mathematical precision. Because comparative genomics is an entire field of study with articles on human and ape genomes published every day, it is not clear why this particular paper caught the eye of Luskin, whose silly claims are now being parroted by creationists around the world. But what is clear is that Luskin doesn’t understand any of this.
-NHL


Leave a comment